
Table of Contents
What is Central Tendency?
- Central tendency is defined as the statistical measure that identifies a single value as representative of an entire distribution of the dataset.
- Central tendency is focused on providing an accurate description of the entire data.
- Central tendency is an expressive summary of a dataset over and done with a particular value that redirects the focal point of the data distribution.
- Along with the changeability (dispersion) of a dataset, the central tendency is a subdivision of descriptive statistics.
- The central tendency is one of the ideal theories in statistics. Though it does not offer information concerning the individual ethics in the dataset, it conveys a broad summary of the entire dataset.
Measures of Central Tendency
- Measures of central tendency are the statistical tools that are used to determine a single value that signifies the center or typical value of a specific dataset.
- Measures of central tendency enables us to simplify complex data into simple and understandable summaries.
- Measures of central tendency reveals the underlying patterns in a data.
- Many times, measures of central tendency are also termed as measures of central location.
- They are also classified as summary statistics.
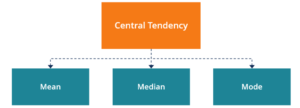
- Mean, Median and Mode are the most commonly used measures of Central tendency.
- Mean: average of all data points
- Median: middle value when the dataset is arranged in order
- Mode: the value that occurs most frequently.
- The mean, median and mode are all usable measures of central tendency, nonetheless, under diverse circumstances, certain measures of central tendency turn out to be more suitable to use than others.
1. Mean (Average)
- Mean (often called the average) is to be expected as the measure of central tendency that people are most at ease which illustrates the sum of all values in a dataset divided by the total number of the values.
- Mean is the ‘balance point’
- The mean (or average) is the widely held and recognized measure of central tendency.
- It can be used with mutually discrete and continuous data, even though it is most frequently with continuous data.
- The mean is equivalent to the sum of all the values in the data set divided by the number of values in the data set. Thus, if we have n values in a data set and they have values x1, x2, …, xn, the sample mean, generally represented by (marked x bar), is:
![]()
- This formula is generally written in a somewhat altered manner via the Greek capital letter called “sigma”, that means “sum of…”:
![]()
- An essential asset of the mean is that it contains every value in data set a portion of the calculation. Furthermore, the mean is the mere measure of central tendency where the sum of the deviations of every value from the mean at all times is zero
Types of Mean
- Arithmetic Mean: It is simply the average value calculated by adding all the values in the dataset divided by the number of observations.
- Geometric Mean: Geometric Mean is used when values change exponentially. It is defined as the Arithmetic mean of the values taken on a log scale.
- Weighted Mean: It is calculated when some values in the dataset are more important than the other values.
- Harmonic Mean: Harmonic Mean is the reciprocal of the arithmetic mean of the observations.
Uses/Advantage of Mean
- It is used when the dataset is symmetrically distributed with no extreme outliers.
Limitations
- Mean is highly sensitive to outliers and can be badly affected by those outliers.
- Outliers will make mean as a bad measure of central tendency.
Median
- Median is the middle value in a dataset (when the values are kept in specific order).
- Median is the mid-value in a dataset that is organized in ascending direction (from the smallest value to the largest value). If a dataset comprises an even number of values, the median of the dataset is the mean of the two central values.
- It is the 50th
- The median is the middle score for a set of data that has been arranged in order of magnitude. The median is not much disturbed by outliers and skewed data. Therefore, to determine the median, assume we have the data below:
| 65 | 55 | 89 | 56 | 35 | 14 | 56 | 55 | 87 | 45 | 92 |
In the beginning, we must rearrange that data into an order of magnitude (lowest first):
| 14 | 35 | 45 | 55 | 55 | 56 | 56 | 65 | 87 | 89 | 92 |
- The median mark is the middle mark – in this example, 56 (stressed in bold). It is the middle mark since there are 5 scores before it and 5 scores after it. This mechanism is sufficient when we have an odd digit of scores, but then again what comes to pass when we have an even number of scores? What if we had simply 10 scores? Well, we basically have to take the middle two scores and average the end result. Therefore, if we look at the pattern further down:
| 65 | 55 | 89 | 56 | 35 | 14 | 56 | 55 | 87 | 45 |
We yet again reorganize that data into the order of magnitude (smallest first):
| 14 | 35 | 45 | 55 | 55 | 56 | 56 | 65 | 87 | 89 |
- Only at this instant, we have to take the 5th and 6th score in data set and average them to get a median of 55.5.
Advantage of Median
Medians are unaffected by the outliers and are better measures of central tendency.
When to Use Median
- Useful for skewed distributions in the dataset
- It is preferred when there are outliers in the data
Mode
- Mode is the most common data point in a data.
- Mode is the most commonly arising value/value that appears most frequently in a dataset.
- In certain situations, a dataset might encompass several modes whereas particular datasets might not have any mode of any kind.
- Mode gives us the most likely experience.
- In a symmetrically distributed data, the mean, median and mode are the same.
- A dataset can have:
- No mode (no repeated values)
- One mode (Unimodal)
- Two modes (Bimodal)
- More than two modes (multimodal)
Limitations of Mode
Mode may not give a good summary in datasets which have no repetition or multiple modes.
When to use the Mean, Median and Mode
With respect to variable
| Kind of Variable | Best measure of central tendency |
| Categorical | Mode |
| Nominal | Mode |
| Ordinal | Median |
| Interval/Ratio (not skewed) | Mean |
| Interval/Ratio (skewed) | Median |
With respect to the dataset
| Kind of Variable | Best measure of central tendency |
| Data is symmetric with no outliers | Mean |
| Data is skewed and has extreme values/outliers | Median |
| Data is categorical or frequency based | Mode |
| Data for all cases | Median (generally) |
References and For More Information
https://corporatefinanceinstitute.com/resources/knowledge/other/central-tendency/
https://statistics.laerd.com/statistical-guides/measures-central-tendency-mean-mode-median.php